Protein structure prediction

Genome-wide sequencing projects generate extensive data on genes, transcripts, and proteins. However, experimental methods for determining protein tertiary and quaternary structures face significant technical challenges and are not keeping pace with the data influx. This discrepancy underscores the need for predictive methods that offer reliable macromolecular models and insights into protein structures without experimental resolution. Simplifying prediction involves representing 3D structures as sequences of structural assignments, recasting the task as a classification problem. For instance, assigning a secondary structure state or solvent accessibility value to each residue results in one-dimensional strings (Figure 1), providing initial insights into protein structure and function.

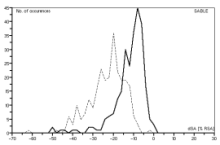
To enhance protein structure prediction and functional annotation, accurate prediction of amino acid residues' relative solvent accessibilities (RSAs) is crucial. Our novel method, SABLE, significantly improves RSA prediction (Ref 1). Unlike other machine learning approaches that typically enforce arbitrary class boundaries, SABLE employs non-linear regression with feedforward and recurrent neural networks for a continuous approximation of RSA. This consensus predictor approach differs from traditional classification methods.

Validation on a diverse non-redundant protein set demonstrates SABLE's effectiveness in enhancing 1D prediction methods for various protein structural characteristics. Incorporating predicted RSA into models reduces feature count and improves generalization. Notably, RSA prediction enhances accuracy in secondary structure (Ref 2), trans-membrane domain (Ref 3), disorder region, and phosphorylation site prediction (Ref 4).
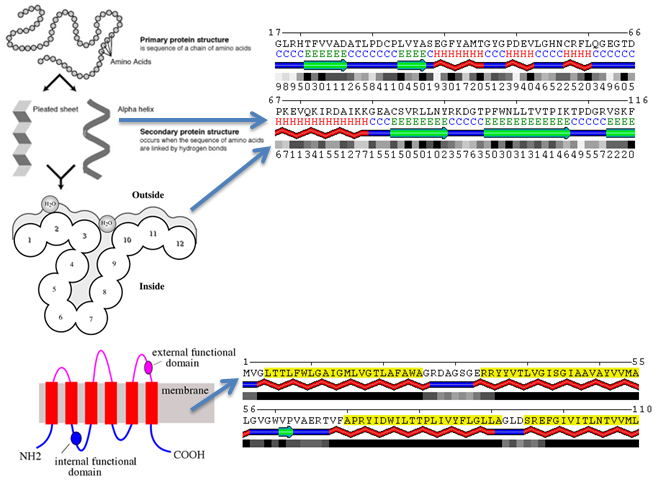

Figure 1. Schematic Representation of Protein Structural Features as Character Strings. Specifically, α-helices are denoted by 'H', β-sheets by 'E', and unstructured loops by 'C'. The degree of solvent exposure is quantified by relative solvent accessibility, expressed as a percentile. Transmembrane regions and soluble segments are coded as 'T' and 'N', respectively, while here transmembrane regions are accentuated in yellow.

References

  1. Adamczak R, Porollo A, Meller J. Accurate prediction of solvent accessibility using neural networks-based regression. Proteins. 2004 Sep 1;56(4):753-67. PubMed PMID: 15281128.
  2. Adamczak R, Porollo A, Meller J. Combining prediction of secondary structure and solvent accessibility in proteins. Proteins. 2005 May 15;59(3):467-75. PubMed PMID: 15768403.
  3. Cao B, Porollo A, Adamczak R, Jarrell M, Meller J. Enhanced recognition of protein transmembrane domains with prediction-based structural profiles. Bioinformatics. 2006 Feb 1;22(3):303-9. Epub 2005 Nov 17. PubMed PMID: 16293670.
  4. Swaminathan K, Adamczak R, Porollo A, Meller J. Enhanced prediction of conformational flexibility and phosphorylation in proteins. Adv Exp Med Biol. 2010;680:307-19. PubMed PMID: 20865514.

Protein-protein interaction

Identification of protein interaction sites is crucial for discerning functionally relevant residues and understanding protein function, thereby aiding experimental endeavors. We introduce a novel predictive model for protein-protein interaction sites, fusing enhanced Relative Solvent Accessibility (RSA) predictions (via SABLE) with high-resolution structural data. This model capitalizes on the tendency of RSA predictions, influenced by sequence-derived evolutionary markers of local environments, to align with solvent exposure levels observed in protein complexes. We hypothesized that discrepancies between predicted and actual RSA (in unbound structures) could serve as reliable indicators of interaction sites (Figure 2A).

Empirical evidence suggests that evolutionary-based RSA prediction methods, which implicitly consider long-range contacts, exhibit biases aligning with surface exposures typical in protein complexes (Ref 1). These biases are particularly evident at interaction interfaces (Figure 2B). Consequently, the divergence between predicted RSA (from sequence data) and observed surface exposure in unbound structures becomes a valuable metric for identifying protein-protein interaction interfaces. Our findings show that RSA-based interaction fingerprints markedly enhance the distinction between interacting and non-interacting sites compared to previous methods (Ref 1), which relied on evolutionary conservation, physicochemical properties, structural data, and other attributes.

Building on these insights, we developed SPPIDER, a cutting-edge method for predicting protein-protein interaction sites. SPPIDER integrates informative features using machine learning techniques to form an effective predictor. This approach has demonstrated superior performance in large-scale evaluations, positioning it at the forefront of the field (Ref 2).

A
B

Figure 2. Novel Fingerprints for Predicting Protein-Protein Interaction Sites, dSA = RSA (SABLE) - RSA (DSSP). A. SABLE exhibits a systematic bias, overestimating the burial of residues at protein interfaces in comparison to their presentation in unbound structures (indicated by dashed line, where dSA is negative), while predictions for non-interacting residues are more precise (solid line, with dSA nearer to zero). B. Rationale for Observed Biases in RSA Prediction: The evolutionary-based RSA predictor compensates for long-range contacts typical in protein complexes.

References

1. Porollo A, Meller J. Prediction-based fingerprints of protein-protein interactions. Proteins. 2007 Feb 15;66(3):630-45. PubMed PMID: 17152079.
2. Porollo A, Meller J. Computational Methods for Prediction of Protein-Protein Interaction Sites. In: Protein-Protein Interactions - Computational and Experimental Tools; W. Cai and H. Hong, Eds. InTech 2012; 472: pp. 3-26.

Protein structure analysis

Despite extensive global efforts to equip biologists with computational tools for protein structure analysis, the complexity and technical expertise required by specialized software deter many potential users. Concurrently, there is an increasing demand for educational tools in structural and molecular biology, aimed at facilitating the comprehension of macromolecular structures and complexes for students at varying levels of expertise. In response, we have developed POLYVIEW, a web-based platform that offers rapid and versatile analysis of protein structures, coupled with high-quality visualization capabilities. This platform comprises three main components: (i) POLYVIEW-2D (Ref 1), which allows protein and complex analysis, displaying results via sequence profiles; (ii) POLYVIEW-3D (Ref 2), providing structural and functional annotation with high-quality 3D rendering; and (iii) POLYVIEW-MM (Ref 3), offering quantitative analysis and animation of molecular motion, including the study of alternative conformers derived from experimental data and computer simulations.

References

  1. Porollo AA, Adamczak R, Meller J. POLYVIEW: a flexible visualization tool for structural and functional annotations of proteins. Bioinformatics. 2004 Oct 12;20(15):2460-2. Epub 2004 Apr 8. PubMed PMID: 15073023.
  2. Porollo A, Meller J. Versatile annotation and publication quality visualization of protein complexes using POLYVIEW-3D. BMC Bioinformatics. 2007 Aug 29;8:316. PubMed PMID: 17727718; PubMed Central PMCID: PMC1978507.
  3. Porollo A, Meller J. POLYVIEW-MM: web-based platform for animation and analysis of molecular simulations. Nucleic Acids Res. 2010 Jul;38(Web Server issue):W662-6. Epub 2010 May 26. PubMed PMID: 20504857; PubMed Central PMCID: PMC2896192.

The POLYVIEW platform is currently used worldwide and has a growing record of the use in educational courses and scientific publications. Below are selected examples of the use of POLYVIEW:

Cover of Clinical Pharmacology and Therapeutics, Issue November 2008, Vol 84 No 5

Hot paper, The Scientist, Issue January 1, 2009

Cover of the book, September 2012

Pharmacy Gate 4D, Project idea and concept by Peter Stasek, Germany, 2012

Cover of ACS Combinatorial Science, February 11, 2013: Vol. 15, Iss. 2

Protein mutations analysis

Cytochrome P450 monooxygenases (CYPs), a large and diverse enzyme family, play pivotal roles in various human biological processes. Extensive genome sequencing has unveiled numerous mutations in human CYPs, linking many missense mutations to a spectrum of diseases. Given the unresolved 3D structures of most human CYPs, there is an imperative need for reliable sequence-based predictions to distinguish between benign and disease-causing mutations.

The novel MutaCYP method has been devised for assessing the pathogenic potential of de novo missense mutations. This technique employs five sequence-based features: predicted relative solvent accessibility (RSA), the variance in predicted RSA among proximal residues, the Z-score of Shannon entropy at specific positions, the disparity in similarity scores, and the weighted difference in size between wild-type and mutated amino acids (refer to Figure 3).

Evolutionary analysis reveals that pathogenic mutations in CYPs predominantly occur at evolutionarily conserved sites and exhibit detrimental similarity scores for the mutated amino acids. Notably, the distribution of Absolute Difference in Similarity Scores (Abs_dSS) suggests a trend for pathogenic mutations to show greater disparity in similarity scores compared to wild-type amino acids.

Predicted RSA (predRSA) is identified as one of the most robust sequence-based indicators of disease-causing mutations. Our previous work, corroborated by findings presented herein, highlights that while the SABLE method accurately predicts RSA, it tends to overestimate the burial state of residues in transmembrane regions, protein-protein interaction interfaces, and structurally constrained areas. Intriguingly, these regions are precisely where deleterious missense mutations are most likely to occur, suggesting an anticipated bias in predRSA towards the burial state that correlates with such mutations.


Figure 3. Comparative Analysis of MutaCYP Feature Distribution Across Benign and Deleterious Mutations. A. Abs_dSS: Absolute disparity in similarity scores between the wild-type amino acid and its mutation at a specific position. B. ss_Abs_dSize: Absolute difference in size between the wild-type amino acid and its mutation, adjusted for similarity score variations. C. zsEntropy21: Z-score of Shannon entropy at a particular position, calculated over a span of 21 adjacent amino acids. D. predRSA: Predicted Relative Solvent Accessibility. E. varPredRSA21: Variance in predicted Relative Solvent Accessibility within a 21-amino acid window.

Reference

  • Fechter K, Porollo A. MutaCYP: Classification of missense mutations in human cytochromes P450. BMC Med Genomics. 2014 Jul 30;7(1):47. PubMed PMID: 25073475; PubMed Central PMCID: PMC4119178.